
Goldshell KA BOX Pro should be shortlisted only by operators who can support 600 W continuously and remove the resulting heat without sacrificing uptime. Its 1.60 Th/s profile is the commercial advantage, but buyers without verified electrical headroom, cooling capacity, and defensible operating economics should not buy it.
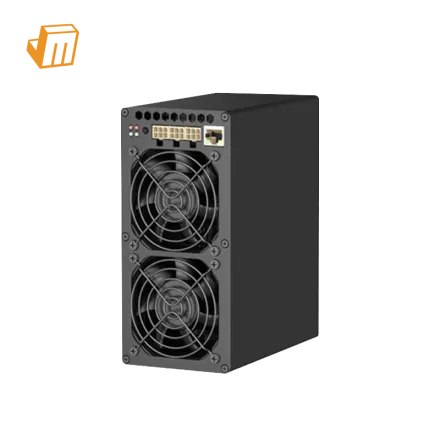
The Goldshell KA BOX Pro serves as a high-density kHeavyHash ASIC designed specifically for the Kaspa network, delivering 1.60 Th/s at a power consumption of 600 W. Its primary operational advantage lies in its refined 375.00 W/Th efficiency, which allows for competitive performance in a compact footprint, though potential buyers must recognize that the volatility of Kaspa block rewards and local electricity tariffs serve as the most likely constraints to reaching a profitable payback threshold.
Revenue Assumption Baseline
The Goldshell KA BOX Pro is engineered to process the kHeavyHash algorithm, which is the backbone of the Kaspa BlockDAG architecture. With a steady-state output of 1.60 Th/s, this miner provides a consistent contribution to the network, provided the unit maintains optimal thermal conditions and stable network connectivity. Revenue generation is directly proportional to the current KAS hashprice, which is a dynamic metric reflecting the network difficulty and the total block rewards distributed to miners. Because Kaspa utilizes a high-throughput Proof-of-Work mechanism, miners are exposed to frequent block discoveries, making uptime and low-latency pool connections essential for maximizing share submission rates.
Calculating revenue requires acknowledging that the total yield is sensitive to the total network hashrate. As more industrial-scale hardware enters the Kaspa ecosystem, the difficulty increases, which naturally dilutes the share of rewards for any single 1.60 Th/s unit. Buyers should evaluate revenue not as a static figure, but as a fluctuating variable that depends on the current total network difficulty and the specific pool fee structures applied to the miner. Because the KA BOX Pro operates at a fixed 600 W draw, it maintains a predictable energy cost, but the net profitability is entirely dependent on the spread between the daily KAS emission value and the operational expenditure of the site.
Strategic ROI Matrix
To assess the viability of the KA BOX Pro, one must reconcile the acquisition cost against the operational efficiency and network-driven revenue. The following table highlights the critical variables that dictate the recovery of capital.
| Financial Variable | Current Input | ROI / Payback Impact |
|---|---|---|
| Miner Model | Goldshell KA BOX Pro | Optimized for kHeavyHash efficiency within a compact chassis. |
| Hashrate | 1.60 Th/s | Determines the gross revenue ceiling before network difficulty adjustments. |
| Power Draw | 600 W | The fixed operational cost driver; directly dictates daily OPEX. |
| Efficiency | 375.00 W/Th | Lower values protect margins against declining hashprice environments. |
| Payback Risk | Network Difficulty | Difficulty spikes extend the payback period by reducing unit reward share. |
When calculating the energy cost, the daily consumption is 14.4 kWh (600 W multiplied by 24 hours). The table below demonstrates how different electricity rates influence the daily and monthly power expenditure, which serves as the primary drag on net profitability.
| Scenario | Electricity Rate | Daily Power Cost | 30-Day Power Cost |
|---|---|---|---|
| Industrial Low | $0.05/kWh | $0.72 | $21.60 |
| Average Residential | $0.08/kWh | $1.15 | $34.50 |
| High-Cost Region | $0.12/kWh | $1.73 | $51.90 |
The payback duration is defined by the formula: Payback days = (acquisition cost + deployment cost - expected residual value) / (daily mining revenue - daily power cost - daily pool and hosting charges - downtime allowance). This formula underscores that profitability is not merely a function of power cost, but a balance between the hardware's depreciation and the market value of the KAS mined. If the daily mining revenue falls below the sum of daily power and hosting charges, the machine enters a shutdown-price scenario where it is more economical to purchase KAS directly than to continue mining.
Daily energy = 0.60 kW x 24 hours = 14.40 kWh/day. This is a hardware energy baseline, not a revenue or payback promise.
Macro-to-Micro Payback Pressure
The macro environment for Kaspa mining is defined by the rapid scaling of the BlockDAG network. As block rewards are subject to the specific emission schedule of the KAS protocol, the total supply growth and the competitive landscape for block discovery create a downward pressure on the yield of any individual ASIC. For the Goldshell KA BOX Pro, this means that while the 1.60 Th/s output is fixed, its real-world value in terms of USD-denominated revenue will fluctuate. Investors should monitor the network difficulty growth rate, as a sustained increase without a corresponding rise in KAS price will inevitably extend the payback cycle.
At the micro-operational level, the KA BOX Pro is a high-density device that requires careful placement to ensure longevity. Despite its compact size, the 600 W power draw generates significant localized heat. Ensuring adequate ambient air circulation is not merely a matter of hardware maintenance; it is an ROI necessity. Thermal throttling, which occurs if the intake air temperature exceeds the manufacturer's recommended thresholds, leads to a reduction in frequency and a drop in hashrate. Any drop in hashrate directly reduces daily revenue while the electricity cost remains constant, effectively destroying the margin. Furthermore, consistent power delivery through a stable circuit is required to prevent the frequent reboots that characterize unstable deployment environments, as each minute of downtime represents a direct loss of potential block rewards.
Goldshell KA BOX Pro must be stress-tested as a kHeavyHash / KAS cash-flow asset rather than judged from a snapshot calculator. The 1.60 Th/s output sets a revenue ceiling, while 600 W and 375.00 W/Th define how quickly electricity cost consumes that ceiling. Network difficulty and hashprice move independently of the hardware label, so the useful question is how much adverse movement the operating margin can absorb before the unit reaches its shutdown threshold. A buyer should model that threshold explicitly and update it whenever pool revenue, tariff, or fee assumptions change.
Electrical planning is part of the investment case. A continuous 600 W load has to be translated into current at the site's verified supply voltage, then checked against breaker capacity, PDU capacity, cable rating, and the other equipment sharing the circuit. The nameplate value is not permission to run a circuit at its limit. If the electrical path has no operating headroom, nuisance trips and unstable voltage can turn an apparently acceptable ROI into downtime, rejected work, and avoidable component stress.
Heat follows the same logic. Nearly all electrical input eventually becomes heat that the room must remove, so intake temperature, exhaust direction, recirculation, dust loading, and ambient temperature belong in the operating model. Thermal throttling reduces effective output before a dashboard necessarily looks catastrophic. Persistent heat-soak also accelerates fan wear and ASIC degradation. The correct comparison is therefore not catalog hashrate versus catalog hashrate; it is stable delivered work after the site's real heat-rejection constraints are included. Verify current technical details against the official Goldshell product documentation.
Pool and firmware behavior provide an early warning when delivered performance diverges from the specification. Track Stratum latency, stale-share rate, reject rate, failover events, and accepted work over a representative operating window. A rising reject rate can erase the advantage implied by 1.60 Th/s without changing the advertised specification. Kernel logs, hashrate-board status, frequency curves, and repeated hashboard dropout events should be reviewed together before blaming the pool or the network. Firmware changes need a rollback path and a saved configuration, not an improvised update during production.
Uptime must be treated as a margin, not as a constant. Planned maintenance, network interruptions, thermal throttling, pool failover, and parts replacement all reduce revenue-producing hours. The same discipline applies to depreciation and residual value: a machine with acceptable current economics can lose resale value quickly when a more efficient generation enters the market or when KAS difficulty rises faster than revenue per unit of hash. A defensible payback model therefore uses conservative availability and residual-value assumptions rather than a perfect-operation forecast.
The shortlist boundary should be explicit. Operators with verified power, controlled airflow, low enough all-in energy cost, and a deliberate KAS exposure can justify deeper due diligence on Goldshell KA BOX Pro. Buyers who still need to guess their tariff, supply voltage, ventilation capacity, pool route, or acquisition cost should not buy it yet. Those unknowns are not minor details; they determine whether the machine is an operating asset or an expensive source of heat with no protected margin.
An alternative miner should be compared on delivered efficiency, serviceability, workload exposure, and exit risk, not only headline hashrate. A lower-output model may be the better asset if it stays online through expensive power periods, fits the existing electrical path, and retains a broader resale market. Conversely, a faster unit can be rational when the site already has spare capacity and the efficiency gain protects the shutdown threshold. The decision should be recorded as a set of measurable conditions so the buyer can revisit it when difficulty, hashprice, or hosting terms change.
Frequently Asked Questions (FAQ)
What variables matter most in payback analysis?
The most critical variables are the current KAS network difficulty, your local electricity rate, and the total acquisition cost including shipping and import duties. These factors dictate the net daily profit, which is the denominator in your payback calculation.
How does electricity cost change the ROI outlook?
Electricity cost is the primary operational expense and often the deciding factor in whether a miner remains profitable. As the KAS price fluctuates, a high electricity rate can move the KA BOX Pro from a profit-generating state to a loss-making state, necessitating a shutdown.
What should buyers verify before trusting a payback estimate?
Buyers should verify that the estimate uses current network difficulty data and a realistic electricity rate rather than theoretical averages. It is essential to subtract all pool fees, hosting costs, and an allowance for downtime to ensure the projected payback reflects actual operating conditions.
Payback Verdict & Next Steps
The Goldshell KA BOX Pro is a capable asset for miners who have secured low-cost electricity and can maintain a high uptime percentage. Its efficiency rating of 375.00 W/Th provides a necessary buffer against the volatility of the Kaspa hashprice, making it a more resilient choice than older, less efficient units. However, the unit is not a passive investment; it requires active monitoring of network difficulty and a clear understanding of the electricity tariff impact on the bottom line. Buyers who can maintain an operational environment that prevents thermal throttling and minimizes downtime will find the KA BOX Pro a functional tool for capturing KAS rewards. For a customized ROI model tailored to your specific power costs and current market conditions, or for assistance with deployment and procurement validation, please contact the JingleMining team today.
Buyer Decision and Next Steps
The Goldshell KA BOX Pro remains a performance-focused machine for the kHeavyHash algorithm, provided the user recognizes the constraints of the Kaspa network difficulty. By focusing on thermal management and minimizing operational downtime, users can effectively manage the payback cycle. We recommend all prospective buyers conduct a site-specific power audit before final procurement to ensure the electrical capacity and environmental conditions support the unit’s 600 W draw, as this is the most common point of failure for long-term mining ROI.